Welcome to Dash IOT Wiki Page

Run the UI Dashboard
Steps to run the Dashboard UI
- Configure the MQTT
- Create UI Config JSON
- Connect to the MQTT Broker
- Run the Config JSON
- View Logs if needed
Connecting to MQTT

Connecting to mqtt is simple and straight forward.
- Fill the Broker Host (Mandatory)
- Username and Password (Optional)
- Client ID (Optional)
- Check “Terms and conditions” box
- Click Connect
Note: the mqtt broker should support websocket and url should be of the schema ‘wss://host:port’
Configuring UI with JSON

Basic JSON Schema
{
  "title": "Test Dash",
  "topic": "iot_dash/topic",
  "set0": {
    "label": "Temp",
    "default": "0.0",
    "topic": "/set0"
  },
  "set1": {
    "label": "Temp",
    "topic": "/set1"
  },
  "set2": {
    "label": "Temp",
    "topic": "/set2"
  },
  "set3": {
    "label": "Temp",
    "topic": "/set3"
  },
  "chart0": {
  	"label":"Chart1",
  	"topic":"/chart0"
  },
  "chart1": {
  	"label":"Chart2",
  	"topic":"/chart1"
  }
}
Status set
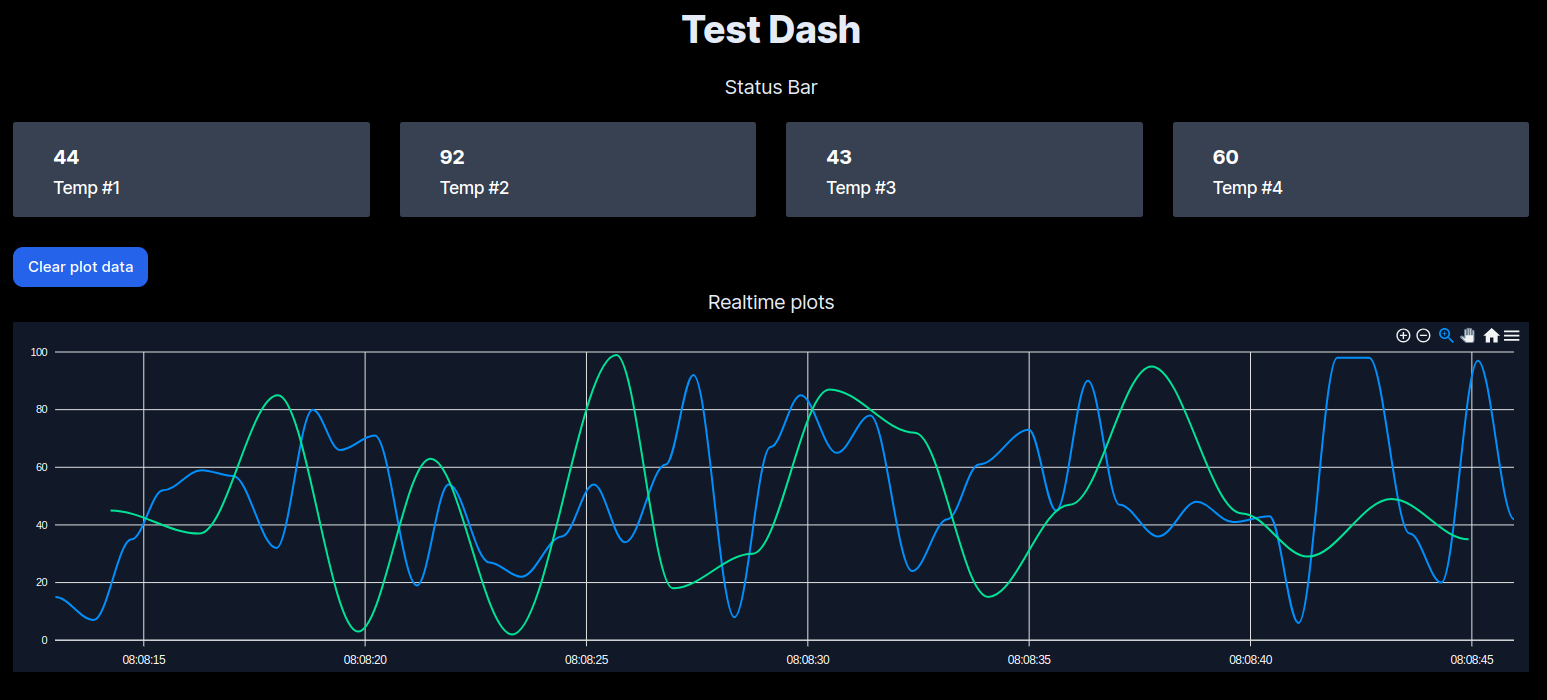
Status set a text based widget for displaying data on cards. Status set can have maximum of 4 cards
set0 to set3
- label (Required) Text to display below each card
- topic (Required) Mqtt sub topic which contains the value
- default (Optional) This value will be set initially
Realtime Chart
Realtime chart widget can display time series data as a line plot. A maximum of two plots can be shown in the chart. X - axis will be local time stamp, calculated in the browser.
chart0 to chart1
- label (Optional)
- topic (Required)
Logging

